Ridgelines
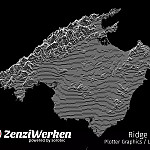
The developer of city roads, Andrei Kashcha, has written yet another great tool and published it on Github: peak-map. There is also a conveniently usable web service here so you don't have to install the software.
The relevant settings are:
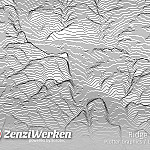
- Height scale: this is a height scaling to 'dramatize' the result a bit.
- Line density: with this you can define the number of generated lines. Better use smaller values.
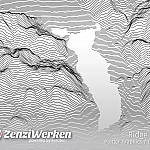
- Ocean level: All heights below the 'Ocean level' are not displayed. This can be used to display lakes very nicely.
- Map Angle: This allows the map to be rotated to allow appropriate 'mountain views'.
The options for color, opacity and line width are not really important, because they can be easily adjusted afterwards with the graphics software. However, it is very interesting that the option 'line fill' has no influence on the vectors, but the hidden lines are still output correctly.
It is worth reducing the number of points in the generated vector graphics afterwards. Illustrator offers the function 'Path > Simplify' for this. With a 'Curve Accuracy' of 97% and an angle threshold of 10°, the number of points is reduced by a factor of 10 without noticeably degrading the display. And we are easily talking about hundreds of thousands of points here. So the reduction is really worth it.


